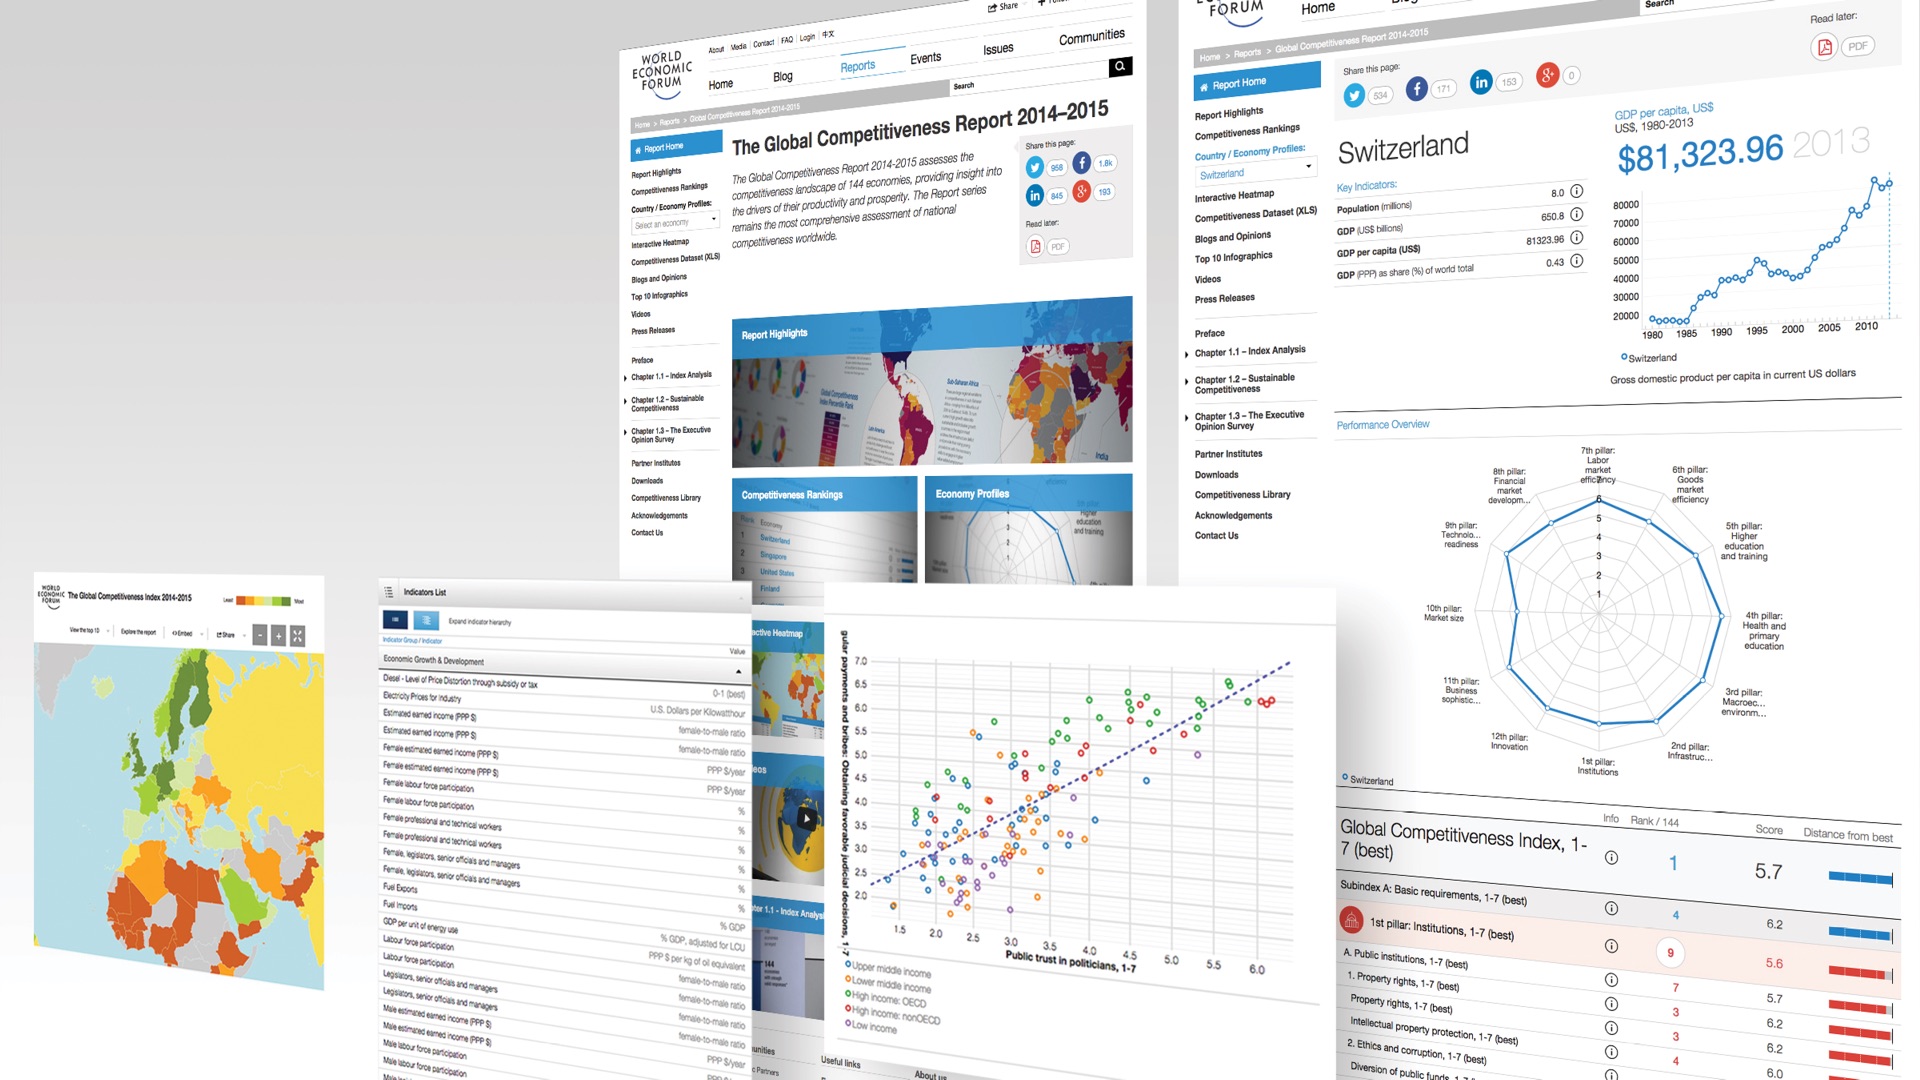
The World Economic Forum produces several Global Indexes each year. They are used by governments, the media, and analysts around the world to benchmark progress and policy opportunities. We built a live data platform to visualise and supply this data more effectively, to enable the creation of online analytical tools, and move away from spreadsheets and PDFs.
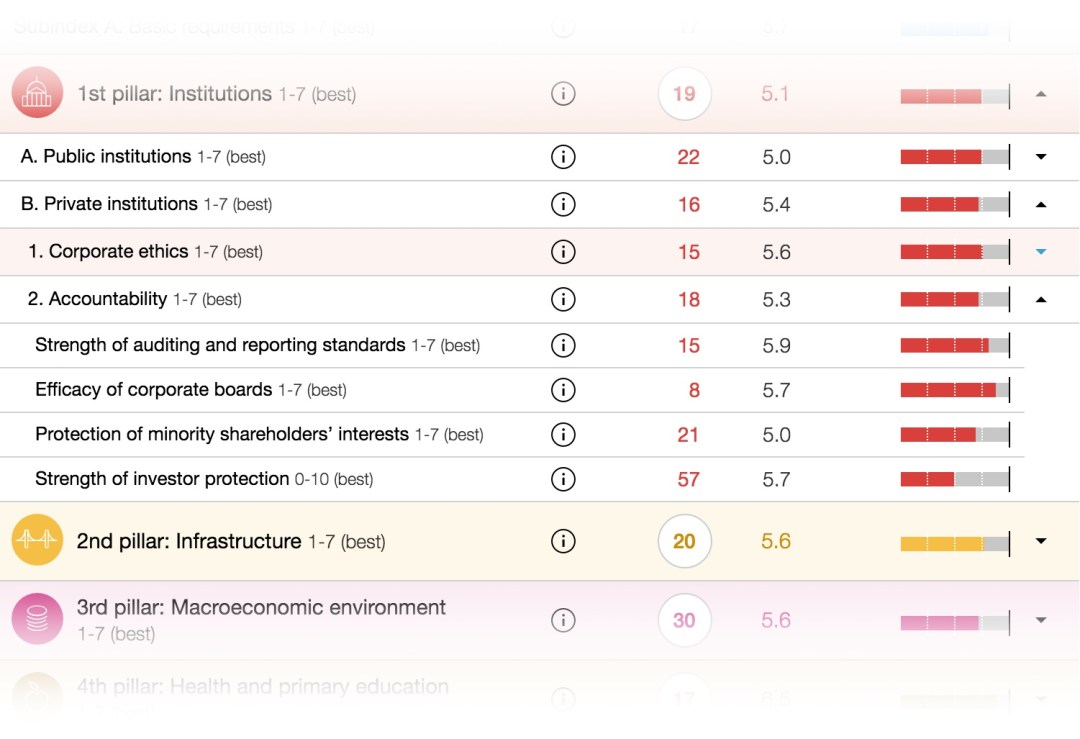
The Global Competitiveness Index is the most significant. It measures economic productivity and ranks 140 economies. It is comprised of sub-indexes, topic driven pillars, and hundreds of individual indicators, as well as a year by year time series. It alone receives over 2.5 million page views per annum and the internal team reply to a constant stream of requests for its data and results.
The indicators are harvested by our economists, and processed and normalised to their analytical methodology from sources such as the OECD, the World Bank, and our Executive Opinion Survey.
Our Global Indexes are: Global Competitiveness; Travel and Tourism Competitiveness; Energy Architecture Performance; the Gender Gap; Human Capital; and Information Technologies Networked Readiness.
The creative process and my role
The project first began in 2012 when I led a visit to the World Bank – to share knowledge with their data evangelists and the development agency who had created their data catalogue. Following that visit I specified our product concept and its User Experience, sourced and managed the specialist talent to build it as a distributed global team, and defined its technical architecture.
Initially the data platform, its tools and data visualisations, were released on our members extranet. From the outset, all charts, graphs and data tables were mobile responsive. And because I had specified an API to supply the data structure, we easily exposed this to our public-facing digital publishing platform. We have since iterated and improved the layout of the scorecard pages, their flow of content and opinion, and ways to interact with and share the data.
Development team and technologies
The long term vision for the data platform is to store, interconnect, and reference all data that we use. With this in mind, I chose the hosted JSON based database, CloudAnt, which is forked from CouchDB. By using a Database as a Service, this also outsourced our DevOps requirements. The API and Indicator Catalogue which powers the back-end of this product, with scorecard pages for each economy, is build with node.js and modularised code for all embeddable charts.
The team comprised one developer for the Node API, one for the mobile responsive data visualisations, one for the front end interface and publishing platform, myself and one of our lead economists as a key collaborator. The initial build was completed in 3 months, and integration into our public-facing platform took 2 weeks.

Scott David leads User Experience strategy and design at the World Economic Forum, across their digital platforms for data-driven knowledge and communities of global leadership.