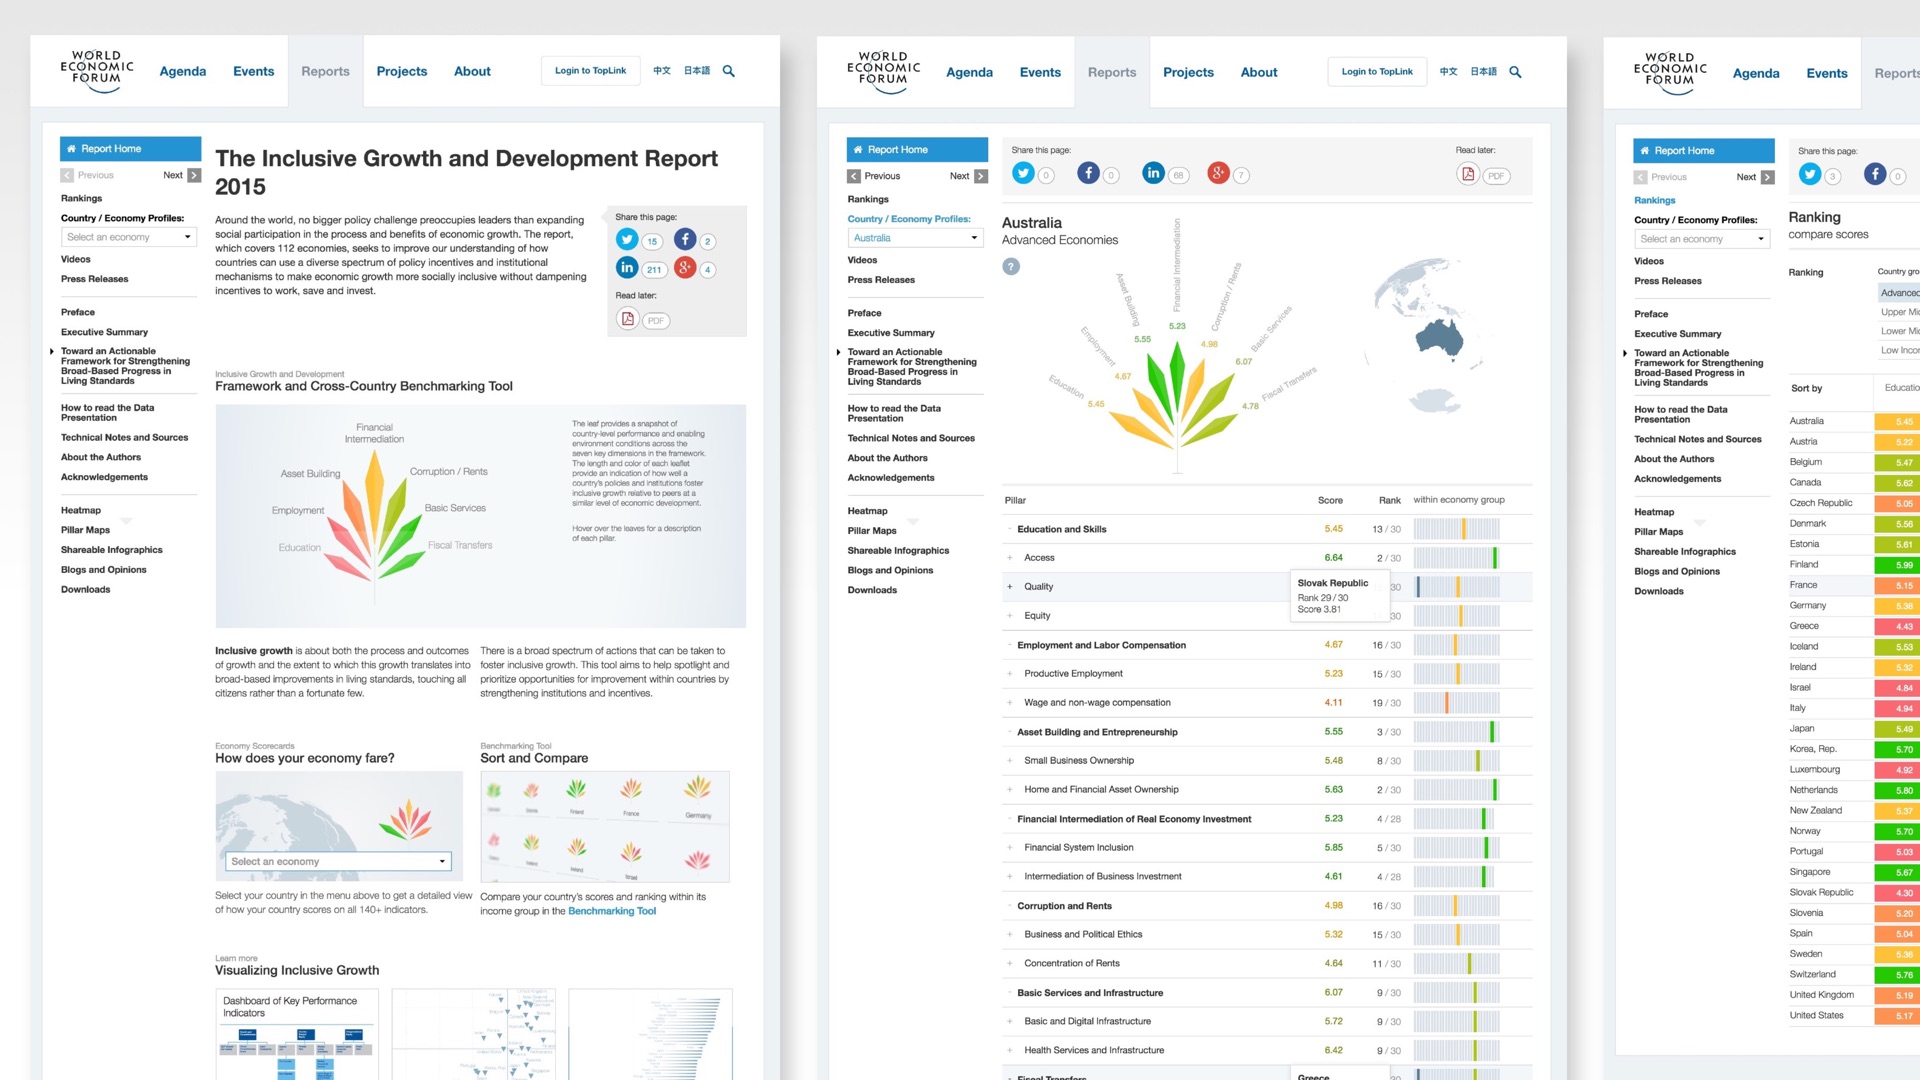
The Inclusive Growth and Development Index and Report was produced by the World Economic Forum to facilitate deeper debate and change around sustainable policy. It includes profiles for 112 countries, as a framework to benchmark social inclusion, inequality and growth.
We published the new data set and its report on our data platform. We also created a unique visual identity for the interactive data visualisations. On the server side, we built digital-first data-to-PDF print technology for the economy scorecard pages. This means our publishing workflow is now entirely digital, and there is no need for the layout to be designed by a separate team.
The creative process and my role
I led the creation of our data and digital first publishing platforms which host this new Index. I also continue to manage the roadmap for these products and its globally distributed development team. This involves on-going oversight of the production pipeline for over 70 digital reports and indexes per annum.
 Development team and technologies
Specific talent was required to produce the data visualisations, fed by an underlying data platform. We worked with a specialist who created the unique identity for this index and data interactions. A team of 3 developers built the data visualisations and data tables, with D3.js and React.js. And one developer integrated the React.js into the digital publishing platform and the server side data-to-PDF using Prince.

Scott David leads User Experience strategy and design at the World Economic Forum, across their digital platforms for data-driven knowledge and communities of global leadership.


