The use of Graph database technologies will transform the way that businesses and other organisations think about and model their knowledge over the next few years. I was invited by Neo Technologies, who are leading this next generation of database technologies, to open the business track of their GraphConnect conference in San Francisco on 21 October 2015.
This video of my talk and transcript below – Building a Global Issues Graph for world leaders – was delivered to a technically-focussed audience of Chief Technology Officers and lead developers, who were looking for ways to think about and enable these new opportunities.
My talk also features the projects that I have led, conceived, and have had built at the World Economic Forum over the past few years.
An introduction
I’m Scott David from the World Economic Forum and I’d like to give you an overview of the way that we’re working with Graphs at the World Economic Forum and the journey that we’ve started.
I’m sure you might be keen to see traversals through a billion nodes, or gigabits of analytics with community detection, but actually our graph is tiny. It is also incredibly powerful – despite being tiny. And it’s also under construction. Nevertheless there’s plenty to show. And what I would like to focus on sharing today is the thinking that led us to a Graph; the unique business opportunity that it presents to the World Economic Forum; and the kind of organization that the Forum is – which is, as you’ll come to realise, an extremely complicated one.
In the process I’ll describe two key projects – which are ‘Transformation Maps’ and ‘Graphs Search and Recommendations’. Both of them started their life with the recognition that leaders and experts need a more broad view of interconnected issues and how disruptive change is emerging.
Drivers of Change
3D printing is changing manufacturing and supply chains; self-driving cars are yet to disrupt; the hotel industry is threatened by the sharing economy; news is constantly under reinvention, chasing readership and profit; and diesel emissions scandals can impact the automotive industry over night. Many many organizations are going through change, including the Forum.
But the Forum is quite unique in that it is a meta-organisation – what we call a platform. Our role is to filter the noise around global issues, to find patterns in the data, and to indicate what is on the road ahead for other organisations. We bring together people from the public sector, business and civil society, who have the power to make change, who can achieve mutual understanding and agreement, and push action forwards. And as such, we are building technologies to facilitate high-level collaboration and knowledge exchange.
The World Economic Forum and Davos
But first, The World Economic Forum is most well known for its Annual Meeting in Davos. It’s a tiny snow town on the eastern tip of Switzerland. It brings together two and a half thousand participants from our member base of the top 1000 global businesses, and other leaders from Government, NGO, Academia and Faith.
 As a flavour of what happens there – in January 2015 John Kerry delivered a special address citing freedom, democracy and the rule of law; Bill and Melinda Gates spoke about sustainable development; Angela Merkel addressed global responsibilities in a digital age; will.i.am was interviewed in one of our smaller rooms; the future of military was debated; specialists talked about human vs artificial intelligence; and there were plenty of quotable moments.
That overview just skims the surface of the real complexity that is playing out in Davos. It is much more than a conference. For us, as the organiser, it is a solution of global complexity through networked thinking.
Let’s remember that the people who come are in large part the leaders of the world – from Fortune 500 CEOs to Heads of State. Imagine the extraordinary logistics behind managing two and a half thousand high-profile participants, with the same number again of military and private security, and then multiply that complexity by the fact that we have one and a half thousand speaking roles in the Programme.
 We have to manage the expectations and requirements of people like Sheryl Sandberg, Eric Schmidt and Satya Nadella. What do they want to talk about? What key messages to they wish to deliver? Are they seen to be speaking to the most important issues of the time, alongside the people they wish to appear with? All that is thanks to our Programme team who work year-round to identify the most important issues to discuss and who needs to come together to discuss them. It’s a marathon of matchmaking and diplomacy.
And why do people come? Well, they have more meetings with influential people in those few days than they do during the rest of the year. They can meet experts to discuss emerging issues and problems that they’re struggling with. So it is also about the unknown, and the emerging, as well. These days deep interconnections can conspire to explode – as we saw with environmental regulations leading to the downfall of VW’s CEO and share price.
So our meeting in Davos is not just a conference – it is a solutions space – where world leaders come to discover, understand, and discuss the most pressing combinations of global issues.
Our technology products and knowledge creation
Helping decision makers make informed decisions and take action also requires an integrated flow of content, analysis and opinion. So throughout the year, with our network of members and partners, we monitor and measure, we identify trends and we build an archive of valuable knowledge which navigates that complexity and change, and which feeds into our meetings.
So let me give you a rapid-fire overview of some of the products that we’ve built, before then looping back to the potential that they’re going to have when connected up to our Graph.
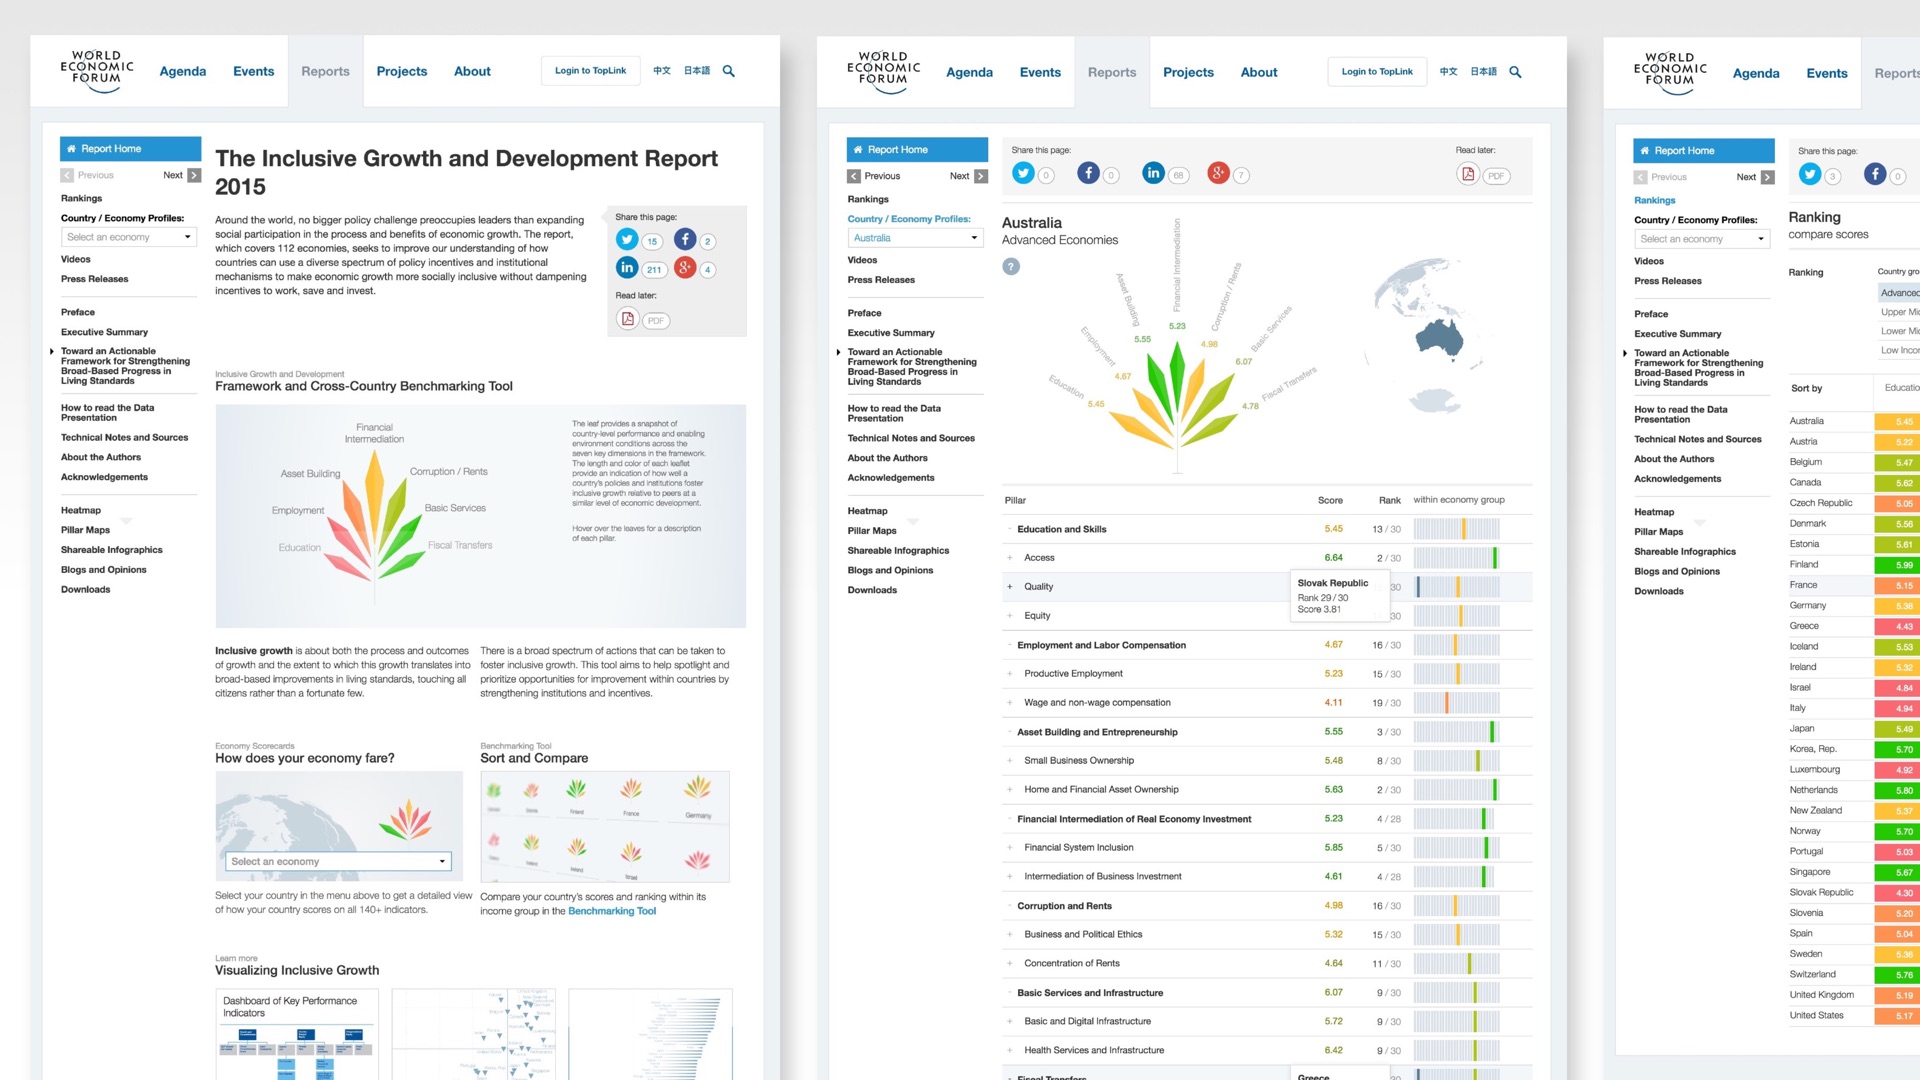
 The Forum produced 73 reports and white papers last year. The most important of which were delivered in digital format. If you saw the World Bank’s announcement a year ago saying that most of their reports were unread you’ll realize that being findable and digital is incredibly important. Besides that, there is also knowledge and data structure locked away in PDFs which is waiting to be released and used. You can see the kinds of issues that we work with – infrastructure, trust, new technologies and finance, employment, education, skills, the eurozone, global trends.
Many teams around the Forum have a need for a digital platform because they’re also creating data sets and data visualisations as part of their analysis. You can see here the Global Risks Report which produces between 30 and 50 issues each year, evaluating their impact and likelihood, connected risks, clusters, and centres of gravity. It is a graph analysis. And they invite experts to discuss the findings, and work with our partner organisations to perform the research.
 This is all evidence-based data, the most significant of which are our Global Indexes of which there are eight, with rankings across a hundred and forty economies, comprised of sub-indexes, topic driven pillars, and hundreds of individual indicators, with editions over a time series.
We have a data API and an Indicator Catalogue which powers the back-end of this product, with scorecard pages for each economy. The indicators are harvested, processed and normalized by our analytical methodology from a number of sources such as the OECD, the World Bank, as well as from our Executive Opinion Survey.
Our Global Indexes, just to list them off for you are: Global Competitiveness; Travel and Tourism Competitiveness; Energy Architecture Performance; the Gender Gap; Human Capital; Information Technologies Networked Readiness; and most recently the Inclusive Growth Report, which is a new index and is important for the Forum, which aims to facilitate a deeper debate and change around sustainable policy recommendations.
During all of our Events, a team from Livestream turns up to film, to stream the video to the world, and archive it on their platform. We built a video API and a configurable player that we embed on our own website, and that other organisations embed on theirs.
All the photographs I showed at the beginning are from Sessions which were filmed, and for which we have Videos, Transcripts, Tagged Topics, Issues, and Speakers associated with them in the data model. And this archive of videos dealing with global issues is growing with every Event that we host, and it becomes a time series of global issue change and the responses that leaders are having to them.
 Also at Davos we have what we call The Social Wall. This is an eight metre screen outside the plenary hall. We use it to track the way that the world is responding to our Event and the influence and reach that the issues and people are having with the world at that time. The Twitter API gives us details of which leader is the most socially active and the most retweeted; the imagery API supplies a moment by moment feed of the world leaders delivering their ideas; the news API finds the articles that are being written about our proceedings; custom D3-based data visualizations show them; and nine experience templates deliver them.
Also during our Events our member’s extranet and apps receive most of their traffic, as members plan their itineraries. It contains all the people, organizations and sessions associated with the forum. In between Events it’s a community space for discussions around common interests. It’s a planning space for action and global issues. And as you can imagine, requirements gathering or end-user testing is pretty tricky with that target audience.
 They don’t use it like Facebook. It’s not that kind of a demand that they have. This is where we’re integrating the products that I mentioned above and also combining strategically valuable knowledge, awareness, discovery and collaboration tools, and its the platform that’s benefiting the most from the graph work that we’re doing.
So you can see there’s huge potential available to us. As you look across that project set just imagine how many entity-relationship sub-graphs could be possible. There’s quite a lot. And how many traversals could be there through issue identification, all the way to solutions.
So let’s recap what the Forum is doing. It’s a content channel; it’s a trend spotter; it’s a global issues analysis machine; it’s a matchmaking service for group collaboration; it’s a benchmark data set provider; and it’s a ‘recommender’ for knowledge about global transformations.
Now, the problem with an unequal distribution of the future is that leaders don’t know the weak signals from the noise, and that means that we act as a filter for them, and we make sense for them, and we reframe the view for them. We find the patterns in the data, and that means that we help to identify and characterize the nature of the discourse and then we enable things to get done.
Transformation Maps
You can understand the reasons why we need a graph. In many ways, it has been in build for over 40 years with paper and spreadsheets. But the complexity is growing massively these days and requires some kind of technological action to be able to control it.
Our chairman, Klaus Schwab, requested a global issues mapping project as a response to the increasing knowledge gap amongst senior leaders of unforeseen impacts. This became known as Transformation Maps.
Whilst we had a database, it had never connected issues between each other. We didn’t even have a taxonomy, to place a Global Issues layer on top of the People layer. And so, what have we started to do about it?
 I know this is what you expect a Graph to look like, and a fairly mess one at that. But actually, if the data model itself is part of the product, and what is actually interacted with directly, then you can potentially rethink the way that it is visualised. And when we released the Transformation Maps at Davos this year it was received exceptionally well. We had CEOs taking over the 82 inch touch screen you can see here to perform demos to their colleagues.
 You can see the way that a key issue for an economy can be affected by a key issue for an industry and between one industry and another. And you can see that this is a graph traversal stepping through several degrees of separation and cause and effect between distant key issues.
This widescreen view that you see here comes to its own as a facilitation tool for group strategic planning, which is one of its primary usage scenarios. It came about thanks to some crucial User Experience time during our Industry Strategy Meeting watching how Chief Strategy Officers discussed and explored its data structure, moving from key issue to key issue and Insight Area to Insight Area.
What if you want to find an expert from our network to talk to? What if you want to discover Sessions at the Event that you are attending, dealing with the subjects that you’re interested in? What if you want to join a Forum project – of which we have around about sixty, condensed into ten global challenge initiative areas?
This product surfaces the nature of our Graph as a knowledge infrastructure – in a way that allows members to discover interconnections between global issues and allows them to frame their strategic conversations within their own organisations.
Now, our Graph work, as I mentioned, is on-going, so a lot of the stuff I’ve shown here is actually in the process of being wired together, and the older infrastructures are starting to give way to the new infrastructures as we go.
To talk briefly about how we went about this – we began with what we do best – which is experts and issue mapping. We drew upon our internal issue-focused teams and our communities and networks. Together we’ve mapped the key issues within a hundred and ten primary global issues, economies and industries, and the key drivers of change upon them, and between them.
We have teams to coordinate our regional meetings in Africa, Middle East, Latin America, and East Asia. We have 21 industry teams, from automotive to telecommunications, and we have over 30 communities. And notably we have the Network of Global Agenda Councils – the world’s biggest brainstorm, with one and a half thousand global experts in eighty councils, who get together in the United Arab Emirates once a year to discuss the main global trends within their knowledge domain.
 This data structure is not magic – it just required a high amount of effort with access to a large number of experts. Over several months we built a prototype content-input environment and monitored the quality of what was coming in; verifying the number of key issues that were being defined in any particular issue area. And we also wrote tagging guidelines to make sure that we didn’t have over or under enthusiasm, confirmation biases and filter bubbles.
You could call this ‘wisdom of the experts’ or ‘massively human in the loop’ or ‘data structure by gigantic think tank’. It’s like a speed-dating data structure of global expertise. If you could get everybody to talk to everybody else, and then capture those conversations in a graph, what would it actually look like? This is our first attempt at what that would look like.
That’s not to say that Machine Learning won’t have a huge role to play in this, for us to scale its data model and improve its tagging and build its taxonomy. It will. The human expertise will increasingly being augmented by machine intelligence.
 Right now this has become a year-round data model that represents the things that we and our members want and need to talk about. And it will become a definition in data structure of our engagement relationships with our members and their organisations. So, it’s awareness raising; it gives strategic focus; and it can evolve over time.
Graph Search and Recommendations
From all that I’ve shown, you can imagine that we needed some kind of powerful Search, which is why we embarked on a Graph Search project. Findability and Relevance are obviously essential with so much volume and separate products.
All the content objects in the examples I’ve shown need to be surfaced in the right place, to the right people, at the right time. But it should be more like a solutions architecture than just string retrieval. So whilst our Transformation Maps are our taxonomic glue, our Graph will become the central infrastructure that joins everything together as the Meta Store. And it seems obvious to me that Recommendations are just a type of personalised Search.
Also, a big reason that we did a Search project was that we’d had relevancy issues for many years. In 2012, after four months of trying to figure out Search weighting with SOLR, we realised that we would need five full-time staff continually classifying and weighting content to get it right. Clearly something was deeply wrong, and at that point we then just cut across to Google Search.
That was on our public site. But on a private platform you can’t rely on Pagerank and Google weighting algorithms to build relevancy. You’re forced to figure it out yourself, and we haven’t necessarily found it easy.
The first step we took was to move to Elasticsearch, and rebuild our index structures with some expertise at hand. And that’s thanks to both Neo in Europe and GraphAware in London. The evidence that SOLR was going to be difficult stacked up so we just moved on.
The second step was to engage in some relevance engineering – intersecting our search results with our graph traversals, supplying weightings and context dependencies that just don’t exist in a standard index. We wanted entity recognition as the entry point for Search relevance, and a hierarchy of assumed needs for the ranking of the top 10 results. We wanted Search and Recommendations as an API infrastructure as well – so that we could put a permissions layer into it and use it across different platforms.
 But why the shoes? One of the first things we did was look at the way Recommender systems work. And a data model problem presented itself immediately – and that’s a reliance on similarity. So let me give you an example. I normally only buy work-related Kindle ebooks from Amazon, but last year I bought a pair of shoes. These shoes. The thing that surprised me was that for three months afterwards Amazon kept recommending exactly the same shoes, which seemed really kind of surprising for an organization so large. Perhaps it was because I bought two pairs of shoes – which I had? Perhaps as such a personal item they were an outlier – they knew it was significant but they didn’t know how to analyse it? Or perhaps everybody who bought leadership and User Experience books also brought Scarpa shoes? Who knows?
So traversals of person-to-person matchmaking similarity kinda reaps rewards. But we were curious about a way of thinking about how recommenders intersect with search.
Instead we started thinking more about Recommendations like Matchmaking for multiple entities – which is what we do during our Meetings. We bring panels of people together in incredibly complex inter-relationships of talent and complementary nature. We figured that was something that we needed to think about within the Search space. Again, it’s more of a solutions engine approach that we’re taking with Search, and as I say, it’s Matchmaking rather than Recommendations.
That’s where we find ourselves on our journey at the moment. With a lot of really really interesting ideas and possibilities to unpack.
Organisational Readiness and next-generation technologies
The last thing I’d like to briefly note before closing is organization technological readiness, and how that played out for us at the Forum. All things are evolving, and ideas flourish when the time is right. For us the time for new technologies was forced by the business changes we’re going through. We needed to fix Search as one of our primary issues. We also came to realize that standard databases would time-out if we started doing the kinds of traversals that we we’re wanting to perform.
It took from 2012 to 2014 to put an Issues taxonomy together that we could all agree upon. Our first Semantic Graph planning was done in 2011 – that’s long enough for the Graph world to get to a point of maturity. And long enough that Machine Learning as a service to arrive – which we’ve also started to apply, utilizing IBM BlueMix and AlchemyAPI and Aylien and others. And the hard librarianship that we would have had to do back in 2011 has basically been replaced with entity and concept extraction with Wikipedia-linked micro-services. And that’s going to help us to scale our Issues Taxonomy, supported by human-in-the-loop expertise.
This next generation of technologies will also bring us new opportunities, which we are exploring and evolving right now, and data augmentation to feed our Graph. It’s going to help us build more, as yet, unimagined products. Finding the right patterns in the data, to help our members focus their strategies on the global issues that matter to them.
Thank you.
Related Content
You can read more about the projects mentioned in this talk from the links below.
Transformation Maps launch in Davos
Launching a social platform for global leaders
A data platform for Global Issue Indexes and Competitiveness
Neo4j interviewed me at GraphConnect

Scott David leads User Experience strategy and design at the World Economic Forum, across their digital platforms for data-driven knowledge and communities of global leadership.